


Great slides, delivered to your inbox
Join thousands of professionals who get our best presentation tips, new templates, and design inspiration from the 24Slides team. Plus, if you ever need a fully custom deck — we’ll be a click away.

Reset your Password
Please enter the email you registered with and we will send you a link to reset your password!
Check your email!
We’ve just sent you a link to . Please follow instructions from our email.


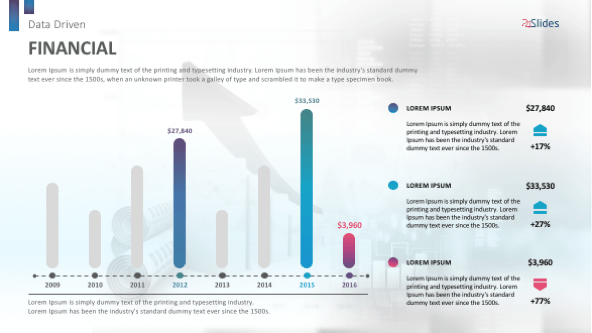
In order to take appropriate actions and make better decisions regarding your company, you need well- organized databases. There is a lot of data and you need to determine what is relevant and what is not in a particular situation. With this data-driven template, you will manage to select any valuable data and successfully present it to your client, executives and investors. The overall design is sophisticated with a possibility to adapt to your customized needs. In addition, all of the datasets can be edited in Excel, so your presentation will always be up-to-date.
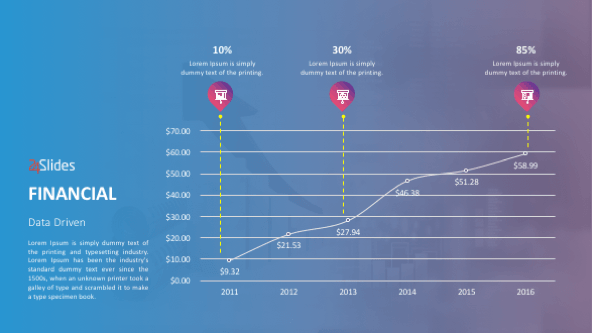
Bar graphs are used to present categorical and numerical variables. They can be grouped into different class intervals and the audience can easily identify certain trends or patterns in the data. Vertical bar graphs are used when presenting time series data where the time units are expressed on the x-axis. The higher the bar, the higher it's underlying value. There can also be grouped vertical bars which are really effective when comparing sets of data about same objects.
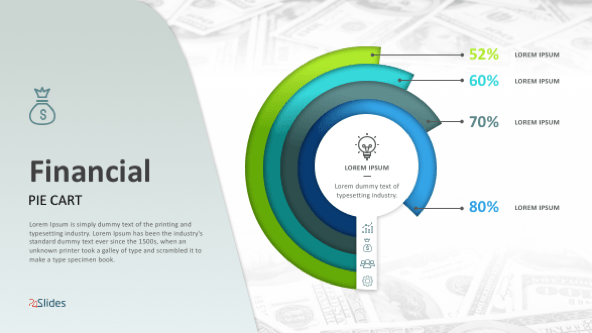
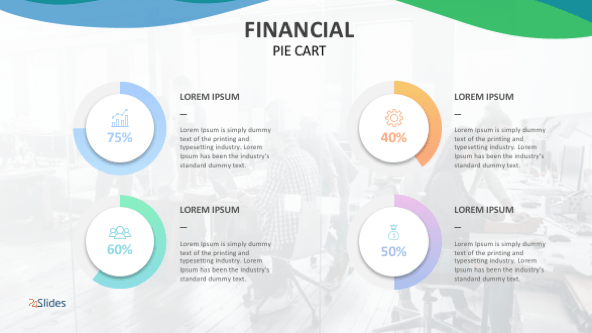
Pie Charts are probably one of the most visual graphs that can be used. They are quite useful for presenting data-driven specifics in relative sizes. You can show how individual amounts contribute to a particular total amount. However, the pie charts will work the best only if you have one data series and if none of the data values are zero or less than zero.
In addition to the vertical bar graphs, the horizontal bars are another useful way of presenting relevant data. Most commonly it is used for showing categorical variables. The horizontal bar graphs use the y-axis for labeling and are the best for comparing the data. Similarly, there are group horizontal bar graphs and are used when the data is too long to fit on the x-axis.
Successful presentation of valuable data through this sophisticated data driven template
The template will enable you to create a professional presentation that won’t leave your audience indifferent.
Vertical Bar Graphs for easier representation of categorical and numerical variables
Comparing different variables is really simple if you use bar graphs in your presentation.
All of the data sets are easily edited in Excel and therefore, always up-to- date
Suitable for dynamic businesses that have lots of data that needs to be well-organized.


FIND OUT MORE ABOUT OUR CUSTOM DESIGN SERVICES
Check out other similar templates

 69 fully
editable
slides
69 fully
editable
slides

Todd Speranzo
VP of Marketing at Avella
"24Slides helps us get PowerPoints on-brand, and improve overall design in a timeframe that is often “overnight”. Leveraging the time zone change and their deep understanding of PowerPoint, our Marketing team has a partner in 24Slides that allows us to focus purely on slide content, leaving all of the design work to 24Slides."
Gretchen Ponts
Strata Research
"The key to the success with working with 24Slides has been the designers’ ability to revamp basic information on a slide into a dynamic yet clean and clear visual presentation coupled with the speed in which they do so. We do not work in an environment where time is on our side and the visual presentation is everything. In those regards, 24Slides has been invaluable."
Nyah Pham
Novozymes
"After training and testing, 24Slides quickly learnt how to implement our CVI, deliver at a high quality and provide a dedicated design team that always tries to accommodate our wishes in terms of design and deadlines."