


We’re uploading new templates every week
We’d like to send you infrequent emails with brief updates to let you know of the latest free templates. Is that okay?

Reset your Password
Please enter the email you registered with and we will send you a link to reset your password!
Check your email!
We’ve just sent you a link to . Please follow instructions from our email.


In the information age, data is everywhere. Every action that you make using a connected device leaves a data footprint. The challenge now is how we can interpret this data and get meaningful information out of it. Once the analysis is complete, the resulting information might be complex, and using adequate graphics to represent that information is the final step in the data analysis process. Through the process, you are taking in computer-friendly information and turning it into human-friendly information. Looking at multiple measurements, results and data points simultaneously can enable you to identify relations between elements which you might have not noticed before. There are various methods of representing this sort of complex information, and this slide pack provides a good variation of stylish looking charts such as treemaps, waterfall charts, and radar charts.
These are a great tool for representing hierarchical data which have values attached to them. They represent weighting and proportions between elements, where accumulating the values of all ‘leaves’ results into the higher-order ‘branch’.
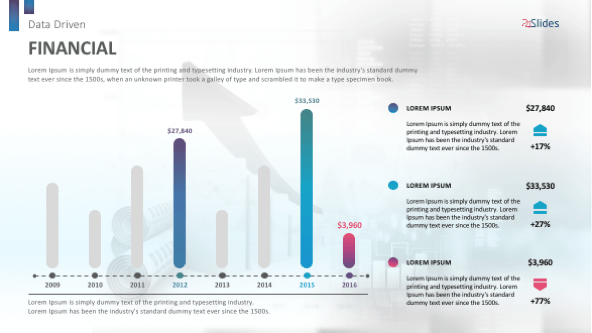
The waterfall charts are excellent at displaying changes from one data point to the other. They generally represent increases with green and decreases with red. The bottom part of one bar is equal with the top part of the previous bar. This type of chart is extensively by day traders to quickly see changes in the stock market.
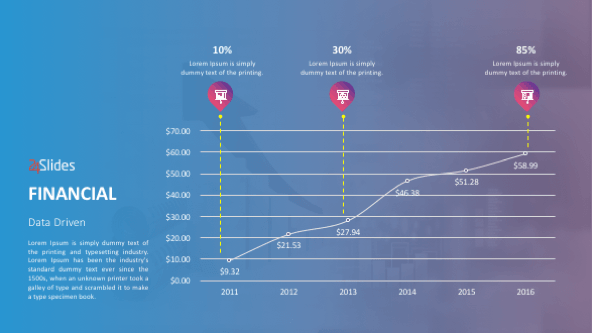
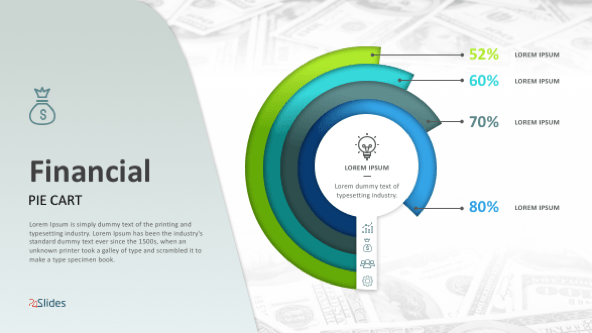
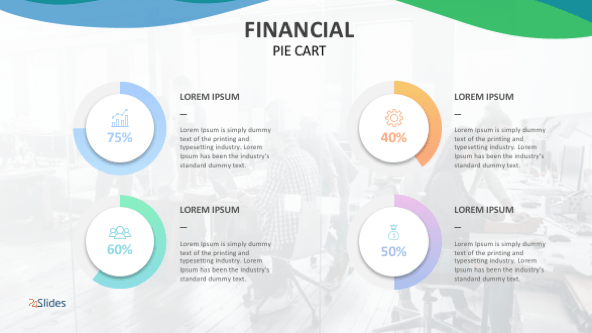
These graphics represent information in a 2-dimensional plane and can easily display the proportions between measurements. By placing related measurements close to each other in a clockwise or counterclockwise way, you can easily visualize and identify trends.
Good visualization ensures excellent communication
By representing complex data accurately using adequate charts, you can convey that information seamlessly to all involved stakeholders
Convey a lot of information quickly
The charts from this slide deck are able of representing multiple measurements and data points simultaneously, allowing you to quickly present a lot of information
Showcase correlations
By looking at multiple measurements, you can find correlations between two or more elements when looking at the numbers over a period of time.


FIND OUT MORE ABOUT OUR CUSTOM DESIGN SERVICES
Check out other similar templates

 69 fully
editable
slides
69 fully
editable
slides
Todd Speranzo
VP of Marketing at Avella
"24Slides helps us get PowerPoints on-brand, and improve overall design in a timeframe that is often “overnight”. Leveraging the time zone change and their deep understanding of PowerPoint, our Marketing team has a partner in 24Slides that allows us to focus purely on slide content, leaving all of the design work to 24Slides."
Gretchen Ponts
Strata Research
"The key to the success with working with 24Slides has been the designers’ ability to revamp basic information on a slide into a dynamic yet clean and clear visual presentation coupled with the speed in which they do so. We do not work in an environment where time is on our side and the visual presentation is everything. In those regards, 24Slides has been invaluable."
Nyah Pham
Novozymes
"After training and testing, 24Slides quickly learnt how to implement our CVI, deliver at a high quality and provide a dedicated design team that always tries to accommodate our wishes in terms of design and deadlines."